
Frugalpac terms and conditions for the purchase of goods

How to Reduce Your Wine Carbon Footprint in 2026?

In 2026, wine lovers are looking beyond tasting notes, vintage ratings, and attractive labels. They are asking a harder question: how much does each bottle contribute to climate change? A wine carbon footprint measures emissions across vineyards, wineries, packaging, transport, refrigeration, and disposal. The glass bottle may feel traditional, but it often carries surprising environmental weight.

Mike Berners-Lee, a leading carbon-footprinting authority, writes, “The first rule of carbon footprints is to keep them as small as possible.” His principle gives wineries and consumers a practical starting point. Reduce unnecessary weight. Use efficient logistics. Protect soil. Measure energy before promising dramatic improvements.

Small choices matter.

A lighter bottle can reduce transport emissions, especially when thousands travel across oceans. Dry farming may lower irrigation demand in suitable regions, although it cannot work everywhere. Cover crops can improve soil health, but they require local knowledge, water, and careful timing. Renewable electricity helps, yet it does not erase emissions from glass production or long-distance shipping.

This guide explores realistic ways to reduce your wine carbon footprint in 2026. It considers vineyard practices, cellar energy, packaging alternatives, distribution, and consumer decisions. The evidence is not always neat. A can may use less material, but recycling systems differ widely. Organic farming can support biodiversity, but certification alone does not guarantee a low-carbon bottle.

We should remain curious, not complacent. Better wine sustainability requires transparent measurements, credible reporting, and honest attention to trade-offs. Some recommendations will fit one region and fail in another. That is precisely why practical evaluation matters.
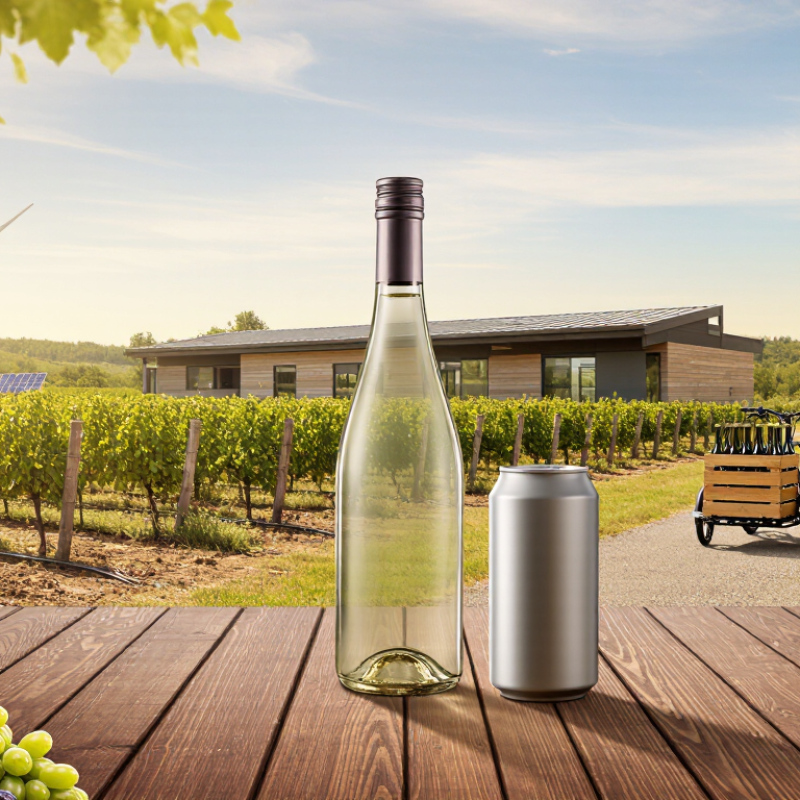
How to Reduce Your Wine Carbon Footprint in 2026?

What a Wine Carbon Footprint Includes

How to Reduce Your Wine Carbon Footprint in 2026?

What a Wine Carbon Footprint Includes

A wine carbon footprint covers every stage from vineyard soil to disposal. It begins with fuel, fertilizers, irrigation, and machinery used to grow grapes. Diesel tractors release emissions directly. Fertilizer production adds emissions before it reaches the farm. Electricity for pumps and cooling also matters. Soil matters too. Bare ground may release stored carbon, while cover crops can improve soil health. However, carbon storage estimates remain uncertain and depend on local conditions.

In the cellar, emissions come from crushing, temperature control, fermentation, cleaning, and wastewater treatment. Glass bottles often create the largest share of packaging emissions. Heavier bottles require more raw materials and fuel during transport. Closures, labels, cartons, and protective materials also count. A practical audit should measure energy and material use, not just utility bills. Supplier data may be incomplete. Estimated values should be clearly identified.

Transport includes vineyard deliveries, winery shipments, warehouses, retailers, and customer travel. Refrigeration can increase the footprint after purchase. In some cases, a long sea journey creates fewer emissions than a short truck journey. Distance alone is not enough. Packaging weight and transport method change the result. Organic waste, damaged bottles, and recycling losses belong in the calculation. The accounting is rarely perfect. That is a reason to improve the data, not ignore it.

How to Measure Emissions Across the Wine Life Cycle

Reducing a wine carbon footprint in 2026 starts with measurement, not guesswork. A reliable assessment follows the bottle from vineyard to disposal. This is the wine life cycle. Define a functional unit, such as one 750-milliliter bottle reaching the customer. Record vineyard fuel, fertilizer, irrigation electricity, and refrigerant leaks. Include emissions from glass, closures, labels, cartons, transport, storage, and waste. Report results as kilograms of carbon dioxide equivalent, or kg CO2e, per bottle.

Use primary records whenever possible. A fuel receipt, electricity meter, and freight invoice are stronger than a generic estimate. Measure direct farm and winery emissions as Scope 1. Count purchased power as Scope 2. Map suppliers, packaging, logistics, and disposal under Scope 3. For transport, record distance, load weight, vehicle type, and empty return trips. Packaging deserves close attention. A heavier bottle can add emissions before it reaches the shelf. Refrigerated storage may also change the result.

Check each calculation against recognized life-cycle methods and current emission factors. Keep the data year, source, assumptions, and unit visible. Test alternatives, such as lighter glass or shorter shipping routes, through scenario analysis. Be honest about uncertainty. Vineyard soil emissions and consumer disposal are difficult to measure precisely. One neat number is not absolute truth. Recalculate annually, invite an independent review, and correct weak data openly. Measurement becomes useful when it guides a specific decision, not when it decorates a sustainability report.

How to Reduce Your Wine Carbon Footprint in 2026? – How to Measure Emissions Across the Wine Life Cycle

Representative greenhouse-gas inventory for one 750 mL bottle of wine

Illustrative Life-Cycle Carbon Footprint
Life-cycle stage Activities included Illustrative emissions
(kg CO₂e/bottle)
Share of total Primary data to collect Practical reduction measures for 2026
Grape growing Fuel and electricity for field operations, irrigation, fertilizer production and application, soil emissions, and vineyard materials 0.27 20.5% Fuel litres, electricity kWh, fertilizer quantities, irrigation volumes, vineyard area and yield Improve nitrogen management, reduce unnecessary passes, use efficient irrigation, maintain soil cover, and increase soil-carbon monitoring without claiming unverified removals
Winemaking and cellar Crushing, fermentation, pumping, cooling, cleaning, wastewater treatment, refrigeration and cellar electricity 0.16 12.1% Electricity and fuel meters, refrigerant losses, wine volume, wastewater volume and treatment data Use renewable electricity, optimize cooling set points, repair refrigerant leaks, recover heat, and improve tank and pump efficiency
Glass bottle production Raw-material extraction, glass melting, bottle forming and transport of empty bottles to the filling site 0.55 41.7% Bottle mass, recycled-content percentage, bottle specification, quantity and supplier-specific product data Select a fit-for-purpose lightweight bottle, increase verified recycled content, avoid unnecessary decorative glass, and prevent breakage
Closures and secondary packaging Closure, capsule, label, carton, case packaging, pallets and packaging production 0.08 6.1% Material weights, recycled content, packaging counts and supplier emission factors Reduce material intensity, use recycled or certified renewable materials, eliminate unnecessary components, and optimize case design
Inbound and outbound transport Movement of grapes, packaging, finished wine and distribution materials by road, rail, sea or air 0.18 13.6% Origin and destination, distance, transport mode, shipment mass, load factor and fuel type Avoid air freight, consolidate shipments, increase load factors, use rail or sea where practical, and shorten distribution distances
Retail and storage Warehouse electricity, temperature-controlled storage, retail handling and estimated product losses 0.04 3.0% Storage duration, electricity use, refrigeration requirements, sales volume and waste rate Improve inventory planning, reduce storage time, use efficient refrigeration and prevent unsold-product losses
Consumer use and end of life Household refrigeration, bottle and packaging collection, recycling, landfill or incineration 0.04 3.0% Country-specific recycling rates, disposal routes, storage assumptions and packaging weights Provide clear disposal information, design for recycling, reduce packaging components and avoid unnecessary refrigeration
Total cradle-to-grave footprint From vineyard inputs through packaging, distribution, consumption and disposal 1.32 100% Use measured activity data wherever possible and document all assumptions Prioritize bottle weight, vineyard inputs, cellar energy and transport because these stages usually offer the largest reduction opportunities

Measurement basis and assumptions

The values above are a representative planning scenario, not a company-specific product declaration. They are expressed as kilograms of carbon-dioxide equivalent (kg CO₂e) per 750 mL bottle and include carbon dioxide, methane and nitrous oxide using 100-year global-warming potentials. Actual results vary substantially with bottle weight, vineyard practices, electricity mix, transport distance, climate, yield, packaging format and waste-treatment route.

For a verified inventory, follow the principles of ISO 14040/14044 and ISO 14067 or the Greenhouse Gas Protocol Product Standard; use supplier-specific and measured activity data before applying reputable secondary emission factors. Report biogenic carbon storage and removals separately from fossil and land-use emissions, and do not subtract removals unless they are quantified, additional, durable and independently verified.

Suggested reporting unit: kg CO₂e per 750 mL bottle and kg CO₂e per litre of finished wine. Recalculate the table whenever packaging specifications, energy sources, production volumes or distribution routes change.

Choosing Lower-Impact Bottles, Closures, and Packaging

How to Reduce Your Wine Carbon Footprint in 2026?

A lighter bottle is often the most practical starting point. Glass can account for a large share of wine packaging emissions, especially when bottles travel long distances. In a cellar trial, weighing empty bottles revealed an uncomfortable truth: attractive, heavy glass added little functional value. Lightweight glass reduced transport weight, but it still required careful drop testing. A broken bottle creates waste and product loss.

Closures also deserve closer attention. Aluminum caps are light, consistent, and widely recyclable in many regions. Natural cork can perform well when sourced responsibly, but availability and recycling systems vary. Closure choice should match the wine’s intended aging period, not tradition alone. It is easy to overstate one solution.

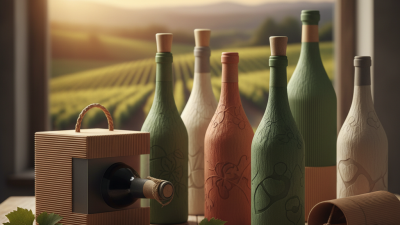
Packaging around the bottle matters too. Recycled-content cartons, right-sized cases, and paper-based inserts can reduce unnecessary material. Avoid oversized boxes with empty space. They use more fiber and increase shipping volume. Bag-in-box formats may suit fresh wines, although consumer acceptance and local recycling remain uneven. Our first packaging change was not perfect. Some cartons weakened in humid storage, forcing a redesign. That lesson still matters: measure bottle weight, breakage, pallet efficiency, and recovery rates before switching materials. Ask suppliers for recent lifecycle data, recycled content, and disposal guidance for the destination market. Claims should be checked, not decorated.

Reducing Emissions in Vineyards, Wineries, and Transport

How to Reduce Your Wine Carbon Footprint in 2026?

In 2024, the OIV estimated global wine production at 225.8 million hectolitres, the lowest in six decades. Weather is not the only concern. Vineyard emissions come from diesel tractors, nitrogen fertilizer, irrigation energy, and soil carbon loss. Measure fuel and fertilizer per hectare before buying equipment. Use cover crops, compost, and targeted irrigation where agronomy supports them. Nitrogen needs restraint. Excess fertilizer can create nitrous oxide, a powerful greenhouse gas. I have seen “regenerative” claims fail when farms cannot show soil or input records. That gap matters.

Wineries should meter electricity, refrigeration, steam, and wastewater treatment. The International Energy Agency reports that renewables supplied about 30% of global electricity in 2023. However, renewable electricity does not erase inefficient cooling. Insulation, heat recovery, and smaller refrigeration loads usually offer more durable savings. Packaging deserves uncomfortable attention. Life-cycle studies, including Point’s 2008 wine assessment, identify glass production as a major hotspot. Lightweight bottles, recycled content, and refillable formats can help, but only where collection and washing systems work.

Transport choices can change the result quickly. The UK Government’s 2024 conversion factors list illustrative emissions near 0.016 kg CO2e per tonne-kilometre for container shipping, versus about 0.107 for articulated road freight. Consolidate pallets, avoid air freight, and coordinate shipments carefully. Record distance, weight, and transport mode. Then verify calculations against ISO 14067 or an independent auditor. That process is slower than a green label, and more trustworthy.

Building a More Sustainable Wine Buying and Storage Routine

Reducing a wine carbon footprint starts at the buying decision, not the recycling bin. The International Organisation of Vine and Wine reported global wine production at about 225.8 million hectolitres in 2024. That scale makes packaging choices significant. I now check bottle weight, transport distance, and closure materials before choosing a bottle. Lighter glass usually means less material moved by road or sea. Boxed wine can also reduce packaging weight, although quality and recyclability vary by market. The carton is not automatically greener.

The Carbon Trust’s carbon-footprinting guidance stresses measuring the full product life cycle, including packaging, transport, refrigeration, and waste. Store wine in a cool, dark cupboard, ideally around 12–18°C, rather than running a wine cooler for bottles that need no special aging. Keep the door closed. Small habits matter. A refrigerator used unnecessarily consumes electricity every day. However, I have learned that “local” does not always mean lower carbon. A nearby bottle transported in a heavy vehicle may compare poorly with lighter bottles shipped efficiently.

Buy fewer bottles with clearer intent. Choose formats that match your drinking schedule, because spoiled wine wastes the farming, packaging, and transport behind it. The U.S. Environmental Protection Agency’s materials data shows that glass container recycling remains far from complete, so rinse bottles and follow local collection rules. Recycling is useful, but avoiding unnecessary packaging is better. My routine is still imperfect: I sometimes buy by appearance. That pause deserves more attention.

How to Reduce Your Wine Carbon Footprint in 2026?

Packaging is one of the largest contributors to wine’s carbon footprint. Choosing lightweight glass, bag-in-box, or carton packaging can substantially reduce emissions compared with conventional glass bottles. Store wine in a cool, stable place and avoid running an energy-intensive wine refrigerator unless it is necessary for long-term storage.

Representative lifecycle estimates for a 750 mL wine equivalent, based on published packaging life-cycle assessments and industry sustainability research. Actual emissions vary by materials, production energy, transport distance, recycling rates, and storage conditions.

Close